2026 Best Ways to Optimize Energy Use at Charging Stations?

Time:2026-11-04 Author:Oliver
0%

A charging station can look busy while wasting energy. Idle chargers, poorly timed battery storage, and unnecessary cooling can raise operating costs even when few vehicles are charging. In 2026, operators face a practical challenge: deliver reliable charging without treating every kilowatt-hour as unavoidable overhead. The answer starts with measurement, not guesswork.

Energy efficiency expert Amory Lovins is widely associated with the line, “The cheapest energy is the energy you don’t use.” That idea applies directly to charging sites. To understand how to optimize energy usage in charging stations, operators can track charger-level consumption, site demand peaks, and standby loads. A half-empty station may still draw power for lighting, cooling, networking, and equipment readiness. Small losses add up.

This guide examines useful measures, from smarter charging schedules to solar generation, battery storage, and preventive maintenance. It also considers charger utilization, local grid limits, and the needs of drivers who cannot wait for a cheaper charging window. A dashboard may reveal an obvious waste—or a misleading pattern. Data quality matters. So does careful testing before changing controls across a whole site. No single technology guarantees savings; results depend on climate, tariffs, vehicle arrivals, and equipment condition. Some recommendations may need revision as operating conditions change. That is worth acknowledging. A credible energy plan should show measured results, disclose trade-offs, and leave room to improve.
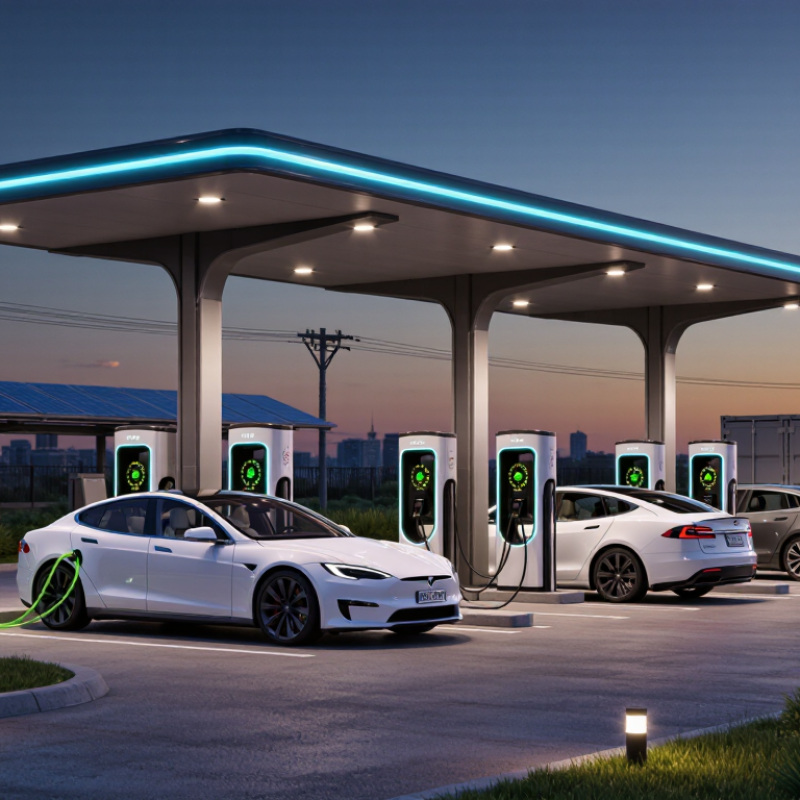
2026 Best Ways to Optimize Energy Use at Charging Stations?

Understanding Energy Use at Charging Stations

Understanding energy use at a charging station starts with the difference between power and energy. Kilowatts describe charging speed; kilowatt-hours measure electricity used over time. A station’s utility meter may include more than vehicle charging, such as lighting, ventilation, screens, and cooling equipment. Small loads add up.

For example, a dispenser delivering an average 150 kW for 30 minutes transfers 75 kWh to a vehicle. The site may draw more because power conversion and thermal management use energy too. Comparing meter readings with dispenser records helps reveal that gap. It is not always obvious: readings can cover different equipment or time periods.

The International Energy Agency’s Global EV Outlook 2024 estimates that electric cars used about 130 TWh of electricity worldwide in 2023. In its Stated Policies Scenario, demand rises to roughly 1,100 TWh by 2035.

That growth makes careful measurement useful, even at one site. Operators can track daily kWh, idle periods, and cooling demand, then compare similar days. A hot afternoon may change auxiliary use; a quiet station still consumes power. Measurements need context, and one week rarely tells the whole story.

Assessing Loads, Losses, and Efficiency

At a charging station, efficiency begins with a clear energy balance: compare electricity entering the site with energy delivered at each charger. The gap can include transformer and cable losses, power-conversion losses, cooling, lighting, and equipment left on between sessions. Small losses add up. The International Energy Agency’s Global EV Outlook 2024 reports more than 4 million public charging points worldwide in 2023, with fast chargers growing 55% that year. More high-power equipment makes site-level measurement increasingly important.

Log power and energy separately. Peak demand, measured in kilowatts, affects electrical capacity; kilowatt-hours show how much energy charging sessions actually use. The U.S. Department of Energy’s Alternative Fuels Data Center lists typical Level 2 charging equipment at roughly 3–19 kW , while DC fast charging commonly spans 50–350 kW . Those ranges help operators identify when several vehicles charging together may drive a peak. Compare charger output with the utility meter, then check cooling and standby loads during quiet hours. A dashboard can still miss poorly calibrated meters or unusual weather effects. Measure before upgrading. Staggering sessions or adjusting charging power may ease peaks, but only if driver demand and site constraints allow it. One caveat: a tidy energy report does not prove that every loss has been found.

Managing Demand with Smart Charging

2026 Best Ways to Optimize Energy Use at Charging Stations?

Managing Demand with Smart Charging

Smart charging shifts charging sessions to match available power, rather than letting every vehicle draw at full speed. A station can use live charger activity, site demand, and electricity price signals to adjust charging rates. Drivers still receive useful charge, while the site avoids sudden demand spikes. Small adjustments matter.

Set a site-wide power limit, then allocate it according to practical priorities. A vehicle leaving soon may need more power than one parked for several hours. Clear departure times and requested charge levels help the system make better choices. Where that information is missing, the schedule may guess wrong. That is worth checking.

A practical pilot should track peak demand, delivered energy, wait times, and missed charge targets. Compare results across busy and quiet periods, and review them with station staff. A neat dashboard can hide a poor driver experience. If queues grow or vehicles leave undercharged, revise the rules. Smart charging works best when the limits are transparent, the data is checked, and people can override a bad schedule when needed.

Integrating Energy Storage and Renewable Power

Integrating storage and renewable power can turn a charging station from a large, unpredictable load into a more flexible site. The IEA’s Global EV Outlook 2024 reports that public charging points grew by more than 40% in 2023, while fast chargers rose by 55%. That rapid expansion puts pressure on local connections, especially during evening peaks. A canopy of solar panels can supply daytime charging, while a battery stores surplus power for later. The fit is not automatic.

A site controller should coordinate chargers, storage, and on-site generation in real time. For example, it can slow charging briefly when several vehicles arrive together, then recharge the battery when solar output rises or grid demand falls. The IEA’s Renewables 2023 forecast puts renewables at 42% of global electricity generation by 2028, up from 30% in 2023. Yet a renewable-heavy grid does not guarantee low-cost power at every hour. Local prices and connection limits matter.

Operators should compare the battery’s installed cost, conversion losses, and expected cycling against peak-demand charges and backup needs. Track solar output, charger utilization, and battery degradation monthly. A shaded canopy or undersized battery may deliver less than the model predicts. Test assumptions with actual site data before expanding. Some uncertainty remains.

2026 Best Ways to Optimize Energy Use at Charging Stations

Illustrative 24-hour charging-station energy profile: solar generation can serve daytime demand, while battery storage can shift surplus solar energy to later periods.

Example data only, not measured at a specific site. Values show energy per four-hour period in kWh. In this example, midday solar generation exceeds demand by 16 kWh; storage could capture some of that surplus for later use, subject to storage capacity and conversion losses.

Monitoring Performance and Improving Operations

2026 Best Ways to Optimize Energy Use at Charging Stations?

Monitoring Performance and Improving Operations

Monitor energy at connector level, not only through the monthly utility bill. Log delivered kilowatt-hours, idle consumption, failed sessions, repair time, and local temperature every 15 minutes. This helps reveal chargers that appear online but deliver less energy during peak hours. Small losses add up.

The IEA’s Global EV Outlook 2024 reports that global public charging points grew 40% in 2023, while fast chargers grew 55%.

As networks expand, compare energy delivered per active port, hourly utilization, and fault-related downtime across sites. NREL’s 2030 National Charging Network analysis modeled U.S. demand for about 182,000 public DC fast-charging ports by 2030. That is a scenario, not a universal target. Use it to test staffing, electrical capacity, and spare-parts plans.

A monthly average can hide a poor Tuesday. Low utilization may reflect unclear signs or inconvenient placement, rather than excess capacity. Review queue lengths, charging curves, and maintenance records together. Set alerts for repeated failures and unusual overnight consumption, then verify them against meter readings. Sensors drift. Keep a simple inspection log, too; data can mislead.

FAQS

How can a charging station measure energy efficiency?

Compare electricity entering the site with energy delivered by each charger. The difference may include cable losses, cooling, lighting, and standby use. Small losses add up.

What is the difference between kilowatts and kilowatt-hours?

Kilowatts measure power demand at a moment. Kilowatt-hours measure energy used over time. Both readings help operators understand site performance.

How much power do common chargers use?

Level 2 equipment often ranges from 3 to 19 kW. DC fast chargers commonly range from 50 to 350 kW. Actual loads vary.

Why should operators check energy use during quiet hours?

Quiet periods can reveal cooling and standby loads that are easy to miss during busy sessions. Meter readings can still be poorly calibrated.

Can staggered charging reduce peak demand?

It may help when several vehicles arrive together. Operators can shift sessions or adjust charging power, if driver needs and site limits allow it. Not always.

How can solar power and batteries support a charging site?

Solar panels can supply daytime charging, while a battery stores surplus electricity for later. A shaded canopy may produce less than expected.

What should a site controller manage?

It can coordinate chargers, batteries, and on-site generation in real time. For example, it might briefly slow charging during a busy arrival period.

What should operators review before installing battery storage?

Compare installed cost, conversion losses, battery wear, peak-demand charges, and backup needs. Track solar output, charger use, and battery degradation monthly.

Does a renewable-heavy grid guarantee cheaper charging?

No. Prices and connection limits vary by location and hour. A tidy energy report also does not prove every loss has been found.

Conclusion

Optimizing energy use at charging stations begins with understanding where power is consumed, when demand peaks, and how charging patterns affect the electrical system. By assessing equipment loads, conversion losses, and overall efficiency, operators can identify opportunities to reduce waste and improve performance. Clear measurements also help distinguish routine energy use from avoidable losses, creating a practical foundation for decisions about capacity and operations.

A thoughtful approach to how to optimize energy usage in charging stations combines smart charging, energy storage, and renewable power where suitable. Charging schedules can be adjusted to balance demand, while storage can help manage fluctuations and support use of locally generated energy. Ongoing monitoring of consumption, equipment performance, and demand patterns enables operators to evaluate results and refine operating practices over time. Together, these measures can improve efficiency, control energy costs, and support reliable charging as usage grows.

Oliver

Oliver

Oliver is a seasoned marketing professional with a wealth of expertise in driving brand awareness and engagement. With a deep understanding of our company's product offerings, he consistently delivers high-quality content that enriches our professional blog. His insights not only shed light on......